Model building basics - Results
The results facilities in Simul8 let you to collect and review measures of performance. This is the goal in the case of most simulation studies. The performance measures predict how the real system will behave.
Most results information about a simulation run is accessed via the ribbon tabs for individual simulation objects. For example: click on the RESULTS button in the ribbon tab for a Storage Bin to view the average waiting time of items that have been through that Storage Bin.
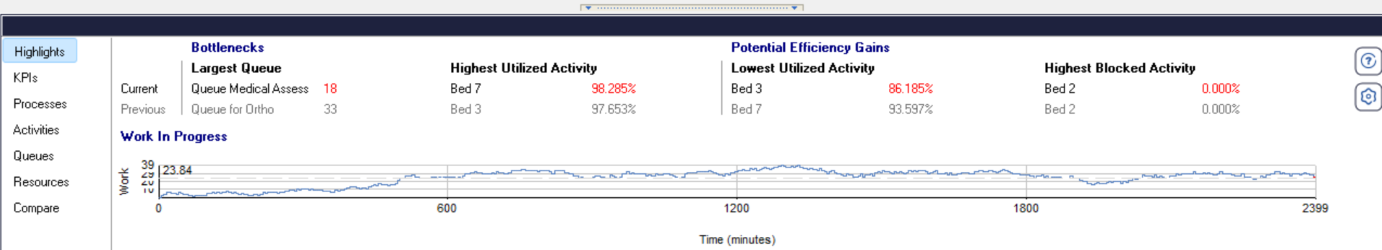
High Level Analytics Panel
The High Level Analytics panel will open automatically when you start running your simulation for the first time.
It shows you a selection of key results about your process. They should quickly guide you to areas where there might be opportunities to improve your process. Then you can use Simul8's more extended results tools to do more deeper analysis.
KPI Summary
You can use the KPI SUMMARY window to see a particular set of individual results figures summarized at the end of each simulation run you make.
To add the Results of all the objects in the simulation to the KPI Summary select the Results menu, All option. All the Results can be removed by pressing the “Remove All Results (selected above) from the KPI Summary button.
Items listed on the KPI Summary can be exported to a number of other packages through the Results Export function on the RESULT menu option.
Some results are usefully summarized in visual form (pie charts, histograms etc). To see these click the appropriate button in the individual results dialog boxes. The data that makes up these graphs can be exported by right clicking on the chart.
The amount of time a Work Item spends in a queue or spends in the whole system (see results for a Work Exit Point) is sometimes different depending on labels of the Work Item. (For example a label might indicate the type of illness a patient has, and that may affect their route through the hospital). You may be interested in seeing these differences. Results Segregation lets you look into these differences.