Path Densities
 Path Densities allow the Routing Arrows of a simulation to change based upon the number of Work Items that travel along each route.
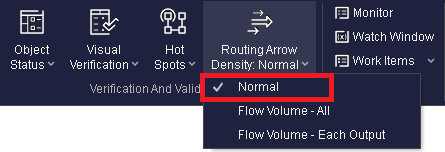
Turn on Path Densities from the View tab.

There are three options available to the user. These options are:
1. Normal
This will display the Routing Arrows as you would normally expect and they will remain unchanged during the simulation run.
2. Flow Volume All
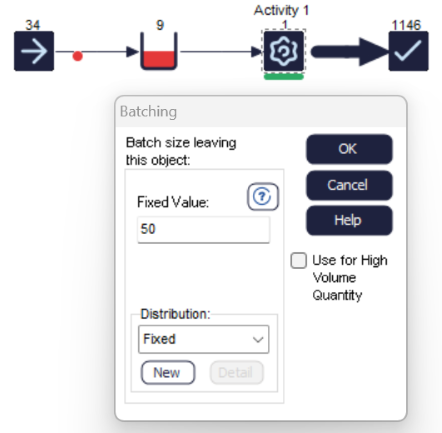
The thickness of the routing arrows will change to indicate the routes have the greatest amount of Work Items flowing through them. As Work Items flow from a Start Point to an End Point the thickness of the arrows will decrease.
In the example below, due to high Batching out size at the Start Point, Routing Arrows have become thicker.
3. Flow Volume Each Output
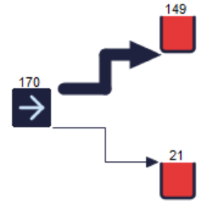
The thickness of the arrows will vary at each simulation Object, based upon the number of items flowing in and the number flowing out. If, for example, an Activity has two routes out with 66% and 33% then the 66% route will have a larger thickness of routing arrow.
In the example below, where 70% of items are routed into the top Queue, and 30% to the bottom Queue, the Routing Arrow for the top Queue is thicker.

Upon selecting option 2 or 3 above the routing arrows will change to dashed lines to indicate that path densities are being used.

Once the Path Density option has been selected, the thickness of the Routing arrows will update at the end of the simulation run, but also when the simulation is paused.

