Pooled Resource Results
 Access the results for a Pooled Resource by double clicking on the Resource to open it's dialog and then clicking Results.
Overall Utilization for Pooled Resources
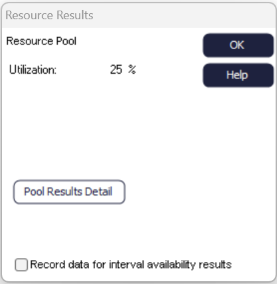 Utilization of Pooled Resources is best explained by understanding the detailed pool results. The utilization shown in the main Resources results dialog for a Pooled Resource is a weighted average of the use of each of the Resources involved in the pool.
If all elements on the pool contributed equally to resourcing the pool then the overall utilization would be the average of the “% of Available” column in the detailed results. However, the “% of Pool” column is used to weight the average by the contribution each Resource made to the pool.
The overall pool utilization does not indicate how much the pool is available. This is because the elements that make up the pool may have been heavily used by other pools or directly by Activities. Look at the detailed pool results to get a better understanding of how your pool is being used.
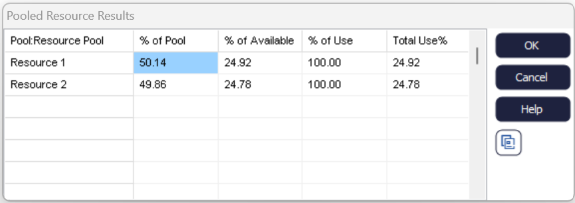
Pool Resource Detailed Results
The detailed pool results can be accessed through the Properties tab of a Pooled Resource by selecting “Results” and then the “Pool Results Detail” button. These results provide data on the contribution of each of the elements of the pool in relation to the utilization of the pool.
This dialog is only available for pooled results when some results are available (i.e. once the simulation has been run).
Column 1 - % of Pool
This column adds to 100%. For each Resource involved in the pool it shows the % of the use of the total pool time that derived from that specific Resource.
Column 2 - % of Available
This column shows the % of the Resource's available time that was actually used in this pool.
Column 3 - % of Use
This column shows the % of a Resource's overall Utilization (column 4) that was actually used in this pool. For example, in this case, Resource 1 was the only one actually used at this pool (because 100% of its time, Resource 1 was here), whereas Resource 2 must also have been used in other places because only 27.54% of its 19.54% Utilization was in this pool.
Column 4 - Total Use %
This column shows the overall Utilization of the Pool’s Resources both in the Pool and elsewhere. This can be cross-checked by displaying the Results of the individual Resources that make up the Pool.