Hot Spots
 Hot Spots provide an additional visual verification method to quickly see results based on some key elements of the simulation.
By enabling Hot Spots, simulation objects will become highlighted based on what metric you are measuring. The “hottest” object’s highlight will have the least transparency, and will be indicated with a number 1. Hot Spots are shown when the simulation time is greater than the warm up time.
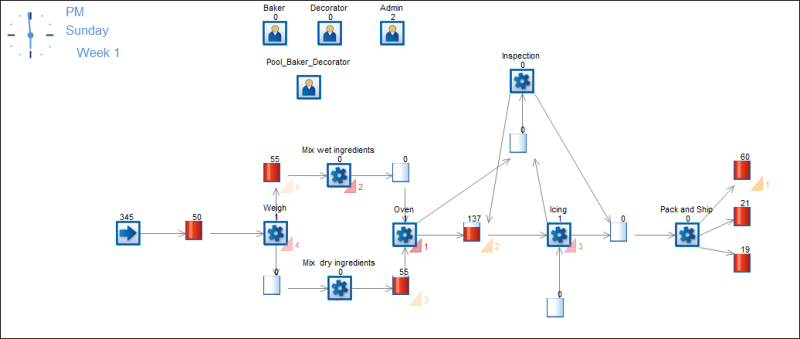
Example simulation demonstrating Hot Spots enabled for Activities and Queues.
Display
Enable Hot Spots from the View tab. You can display Hot Spots for Activities, Queues, and Resources. Use the Show [Object Name] to enable Hot Spots for those objects.
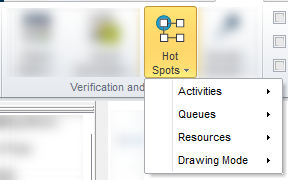
Activities: To enable Hot Spots for Activities, navigate to Hot Spots > Activities > Show Activities.
In the Mode menu, you can choose to display the Hot Spot for either:
- Highest Working Utilization %
- Lowest Working Utilization %
Queues: To enable Hot Spots for Queues, navigate to Hot Spots > Activities > Show Queues.
In the Mode menu, you can choose to display the Hot Spot for:
- Highest Current Contents
- Highest Average Contents
- Highest Average Waiting Time
Resources: To enable Hot Spots for Resources, navigate to Hot Spots > Activities > Show Resources.
In the Mode menu, you can choose to display the Hot Spot for either:
- Highest Working Utilization %
- Lowest Working Utilization %
Show Top: For each simulation object, you can show up to 10 of the hottest objects.
Hot Spot Color: Use the color picker to set the Hot Spot color for each simulation object.
Drawing Mode: Use this menu to choose the display of the the Hot Spots on your simulation window.