Making Your Own Results
We collect a lot of results automatically for you in Simul8 but there might be some that are very particular to your process that we might not record. It's really easy in Simul8 to record in your own. You just need to create a data item (a variable) to record the values and add it to the KPI Summary.
As an example, let's say we wanted to record work in progress, here's how you would do it.
1. Creating Your Variable
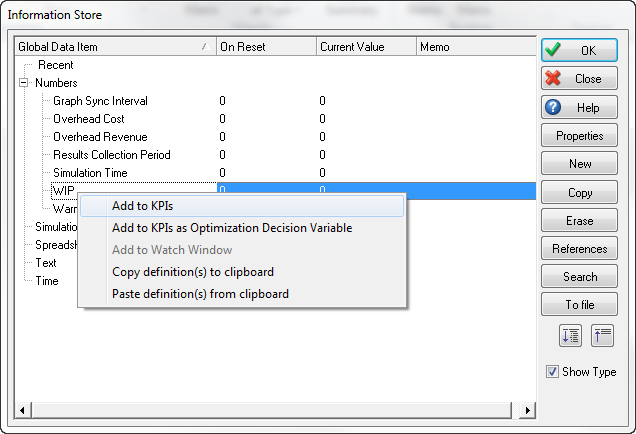
Create your variable, WIP, in the Information Store, typically it's a number variable you want to create. We want to give it a sensible name as it's name will appear on the KPI summary.
2. Adding Your Variable to The KPI Summary
In the Information Store right click on your variable WIP and select Add to KPIs.
Adding your variable to the KPI summary means Simul8 will automatically record the value in a single run and work out the average and the upper and lower confidence intervals when you run a trial. In addition Simul8 will also record how the value changes over time so you can plot it in a chart, see step 4 later.
3. Writing Values to Your Variable
The easiest way to change the value of your variable is through Actions on a simulation object. Here you can tell Simul8 to increment, decrement or even set the value to an expression.
To record our work in progress we'd use Actions in the Work Entry Point to increment our variable WIP by one each time a work item and arrives. Then we'd use Actions in all the objects that link into our Work Exit Point in our simulation to decrement our variable WIP by one.
If you find you need a bit more control over when your variable is updated you can also use Visual Logic.
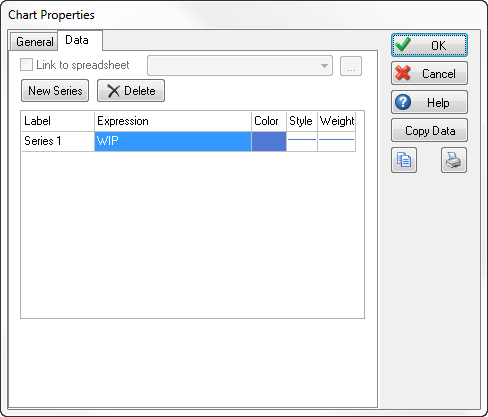
4. Displaying Your Variable In a Chart
If you want to see how your result changed over time the best way is to chart it. From the Insert tab select charts and click new. Then add a series on the data tab for your variable, done! You can also customize your chart further using the other display options or even add other series to see lots of results on one chart.