Display+
What is Display+?
Display + was added to Simul8 in Release 7. It's a group of Visual Logic commands that give you total control over the visual display of your simulation. The commands are:
Because its done through Visual Logic the image changes can be event or time driven. So for example you could have text appear whenever a shift change occurs or when stock levels fall below a certain level, or draw a graph of your results as the simulation is running.
Worked Example - Drawing Your Own Chart
Drawing a chart with Display+ is really easy. There are 4 steps that are looped through continuously.
- Get the result to be graphed
- Draw your X and Y axis
- Draw your data point
- Move forward one step on the X axis
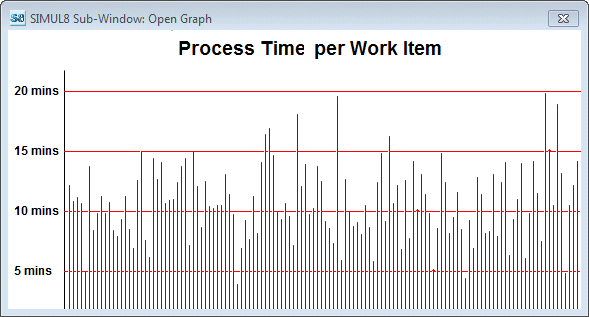
As an example we'll discuss how you go about creating the bar chart below, but the same principal applies to creating any type of chart.


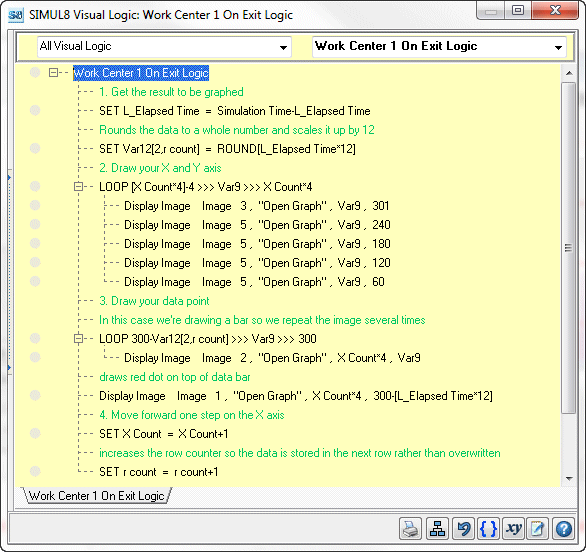
Above is the code used to generate the graph.
Step 1: Get the Result to be Graphed
In this case we're graphing the processing time for each Work Item. We have used a Label, L_Elapsed Time, to store the time the Work Item entered Activity 1. We subtract this from the simulation time the Work Item exits at to get the process time we want to graph.
Display+ can only put images at whole pixel locations so we use the Round function to set it to the nearest whole number. There won't be much difference between the data points we have to graph so we also multiply the result by 12 to make the difference between the points we're graphing bigger and hence the graph easier to read.
Step 2: Draw Your X and Y Axis
The first loop in the code draws the X axis and the grid lines at 5,10,15 and 20 minutes. This is done by drawing a small red dot each time a Work Item is processed, the dots then join up to create the lines.
In this case we know approximately what the Y axis will be so we've drawn this on screen using the standard drawing objects. You could of course just draw your X on screen as well but this means you could end up with an axis that is too long or too short as the number of Work Items processed will vary a lot depending on the length of the run.
Step 3: Draw Your Data Point
Depending on the type of graph you're drawing the exact steps you have to go through at this stage will be different. As we're drawing a bar chart here we use a loop to draw a dot at the data point and then another dot each pixel down until we get to the zero axis. The key thing to remember here is that the (0,0) coordinate for the Display Image command is at the top left hand corner of the screen so you're drawing from the top down rather than from the axis up.
Step 4: Move Forward One Step on the X Axis
So that you don't keep drawing over the same data point you need to use a variable to store the point you're at on the X axis. Then when you've drawn each data point increment this variable so the next point drawn is a few pixels to the right.
Tips
- If you're going to display the graph in a sub-window decide on the name of it before you start coding. If you change you're mind you'll have to change every Display Image command that references the sub window.
- Once you've got your axis etc. placed in the exact location you require turn off the Graphics toolbar. This prevents any of the onscreen graphics from being edited or changed, so they'll effectively be locked to the location you've placed them at.
- To help you find the exact pixel location you want to place the images at drop an object on screen then use Quick View to look up the pixel location of your object. This saves a lot of fiddling about.
- While you're figuring out the pixel location you want to place the images at you'll probably drop lots of images on screen. To get rid of them quickly select CLEAR ALL DISPLAY+ from the Design tab
Download the Example
When you're up to speed with this example try looking at this slightly more complicated example.