Conditional Queue Graphics
Certain queue types can now have conditional color rules, which allows for a queue to dynamically update its color based on certain conditions and restrictions during the run time of the simulation.
Use Conditional Queue Graphics to update the color of the queue either based on it's Current Contents, or by it's Average Queuing Time.
The color rules placed on a queue will allow for quick visibility if there are any issues in the simulation. For example, this feature can be used to place rules on a stock of items which will update the queue's graphics to red from green, should the contents of the queue drop below a certain amount (indicating that supplies are running low). Alternatively, the Average Queuing Time function can be used in a setting where items must not be waiting too long in the queue - this could be used in a simulation for a hospital waiting room, where the queue will update its color should patients in the hospital be waiting too long to see a doctor.
The queue graphic types that are supported are Tank, Block, and Graph.
Enabling the Color Rules
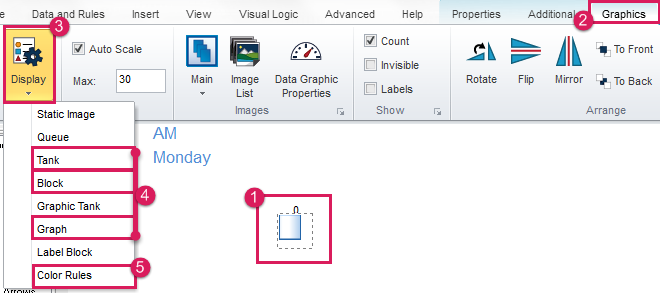
- First, select the queue to apply the rules to.
- Navigate to the Graphics Tab on the ribbon
- Choose the Display dropdown
- Choose either Tank, Block, or Graph to change the queue's graphic type in order to use the Color Rules
- Finally, select Color Rules from the Display dropdown to open the Color Rules dialog for the queue
Creating Color Rules
Choosing the Rule Type
Once the Queue Color Rules dialog is open, the rule type must be set using the radio buttons.
Please Note: Only one rule type may apply to a queue at any one time.
Use Current Contents to change the color of the queue if the contents of the queue a key indicator of the simulation. The inputs will represent the number of individual work items in the queue.
Use Average Queuing Time to change the color of the queue based on how long (on average) work items have been spending in the queue. The inputs will represent the time (in the simulation's time units - modified in the Clock Properties) work items have spent in the queue on average.
Select any created rule via the radio button to the right hand side of the rule. Once selected, the “Erase” button can be used to delete that specific rule.
Choosing the Operators
Using Less Than Operators
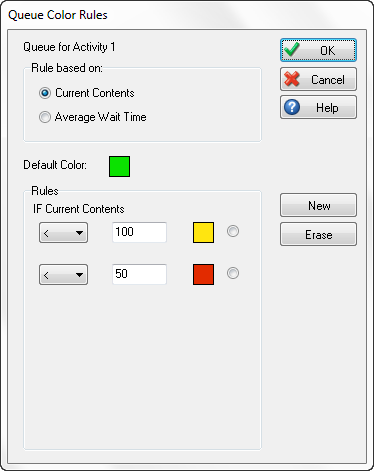
When using the Less Than, or Less Than or Equal To operators, input the values in descending order from largest to smallest. In the example below, the simulation may be looking at a queue that handles the stock level, and want to show when this level drops below a certain stock amount.
In this example, the Current Contents option is chosen as the stock level is being monitored. Imagine there is a Start Up value on the queue of 200. Therefore, the default value is green. If the queue drops below 100 items, the queue becomes yellow, and if it drops below 50 units, the queue becomes red.
Using Greater Than Operators
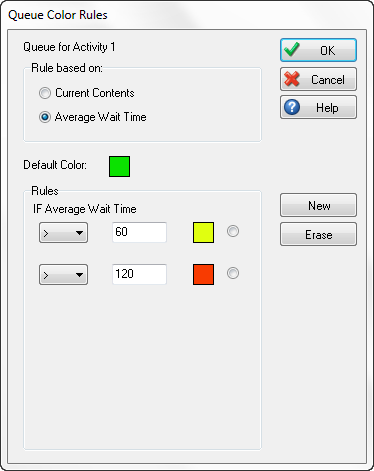
When using the Greater Than, or Greater Than or Equal To operators, input the values in ascending order from smallest to largest. In the example below, the simulation may be looking at a queue that handles patients waiting in the hospital, and want to show when this wait time breaches a certain amount.
In this example, the Average Queuing Time option is chosen as waiting time is monitored. Here, the default value is green, indicating that the queue's average waiting time is within the limits. If the wait time becomes greater than 60 (minutes), the queue becomes yellow, and if it becomes greater than 120 (minutes), the queue becomes red.
Using Greater Than Operators
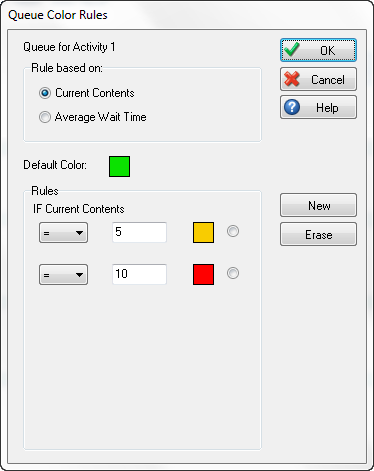
When using the Equals To operator, the queue will change to the selected color only when the queue's contents or waiting time is exactly as specified in the input.
This could be used in a scenario where there are capacities on the queue (using the queue Capacity feature), and the color rules can draw more attention to when this capacity has been reached.