Distribution Viewer
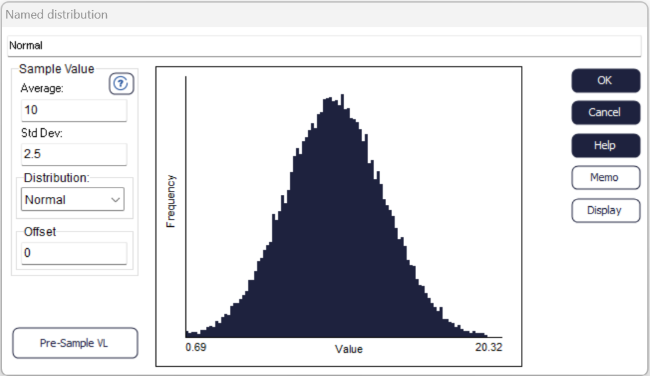
The Distribution Viewer gives a visual representation of your data and distribution. This will open as in the Named Distribution dialog when creating custom distributions.
The histogram is drawn based on the distribution and parameters entered on the left-hand side of the dialog. Changing the distribution will update the histogram.
The minimum and maximum values are displayed on the x-axis, to show the range of vales you can expect from the distribution. The blue bars represent how often a value is likely to be sampled. The higher the bar, the more likely this value will be sampled from the distribution.
Clicking the Display button allows the display settings to be changed:
Number of Samples
This allows you to sample from the distribution, up to 1 million times, to generate a dataset which is used to draw the histogram in the Distribution Viewer.
Refresh Histogram
Click the Refresh Histogram button to redraw the histogram every time you make a change.
Randomize
You can choose whether you want to change the random stream each time you refresh the histogram. Unchecked will set the stream to be the primary seed value (the same seed which is locked when you first open Simul8). Checking the box will change the seed value each time the ‘Refresh Histogram’ button is pressed.
