Shaping childhood obesity services for FUNSALUD
- Industry
- Healthcare
- Location
- Mexico City, Mexico
- Goals
- Evaluate the financial impact of childhood obesity to prepare with future demand in healthcare services
Achievements with Simul8
-

-
Predicted the overweight population is likely to incur an additional healthcare cost of 84%
-
-
The costs to treat obesity are projected to rise by 108%
-
-
Evidence shows the obese male population had the shortest life expectancy which was 14 years less than a normal weight female
About the project
Child overweight and obesity are a real problem at school age. In Mexico, current rate is 26% for children 5 to 11 years old. Overweight and obese children are associated with a higher prevalence of metabolic comorbidities during adulthood, which lead to cardiovascular risk factors at younger ages.
The Mexican Foundation for Health (FUNSALUD) used Simul8 to understand the economic burden of obesity in Mexican children to improve population health and pathways. FUNSALUD used the study to determine the shape their health services will need to be to cope with future demand and to project the associated cost of treatments.
The objective of this study is to estimate the economic burden of diabetes, hypercholesterolemia and hypertension influenced by overweight and obesity in a simulated cohort of Mexican children aged 5 to 11 years and during their lifetime.
Understanding the impact
Using Simul8, FUNSALUD developed a simulation of the treatment costs of diabetes, hypercholesterolemia, and hypertension in a school age population aged 5-11. The simulation was populated with data from FUNSALUD research and the Mexican National Health and Nutrition Survey.
Simul8 was chosen as its discrete event simulation approach has the capability of handling each child as an individual. This delivered a more detailed and accurate analysis of the data as age, disease, gender and the varied costs associated with each treatment could be specified for each child.
In this first phase of the model FUNSALUD considered primary diseases costs of diabetes, hypertension and hypercholesterolemia but not any of their complications. In a next phase, complications costs and its probabilities were added. Currently this model can be used to estimate future costs due to overweight and obesity in any country as long as the basic data mentioned previously is available. Most important is that this model considers weight variations over time.
“Simul8 provided a quick and easy method that allowed planners to look to the future to understand service requirements and the associated costs.”
AstraZeneca, FUNSALUD
The Method
Using Simul8 to find a solution
A discrete event simulation model was built to emulate weight gain of a school age population (5 to 11 years old), its related metabolic comorbidities (diabetes, hypertension and hypercholesterolemia) prevalence and death rate for each weight level, normal weight (NW), overweight (OW) and obese (Ob).
The model starts creating 1/1,000 of the population aged 5 to 11 years old reported by the National Population Commission (CONAPO) for the year 20091. Entry values for the model are shown in Table 1.
Costs of comorbidities as outpatient annual maintenance were obtained and brought to present value from the Popular Insurance tabulators2, considering doctors’ visits and drugs for diabetes: $1,152; hypertension: $632; hypercholesterolemia: $399 (Table 2).
In this first phase of the model we only considered primary diseases costs of diabetes, hypertension and hypercholesterolemia but not any of their complications. In a next phase we will add complications costs and its probabilities.
Currently this model can be used to estimate future costs due to overweight and obesity in any country as long as the basic data mentioned previously is available. Most important is that this model considers weight variations over time.
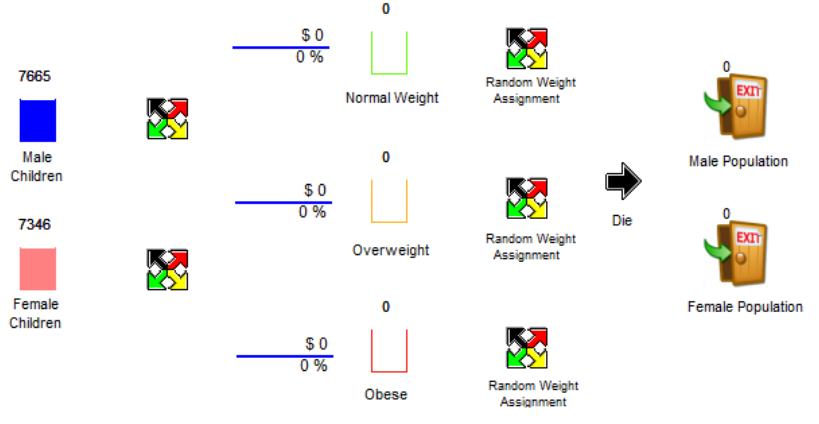
Table 1: Input population for the model
| Age | Male | Female |
|---|---|---|
| 5 | 1,018 (51.1%) | 973 (48.9%) |
| 6 | 1,055 (51.1%) | 1,009 (48.9%) |
| 7 | 1,099 (51.1%) | 1,050 (48.9%) |
| 8 | 1,153 (51.1%) | 1,103 (48.9%) |
| 9 | 1,133 (51.1%) | 1,086 (48.9%) |
| 10 | 1,108 (51.0%) | 1,065 (49.0%) |
| 11 | 1,102 (50.9%) | 1,062 (49.1%) |
| Total | 7,668 (51.1%) | 7,348 (48.9%) |
Table 2: Adult prevalence of metabolic comorbidities and costs
| Diabetes | Hypertension | Hypercholesterolemia | |
|---|---|---|---|
| Normal Weight | 4.89% | 9.62% | 3.77% |
| Overweight | 7.25% | 14.89% | 8.33% |
| Obesity | 8.77% | 24.14% | 12.40% |
| Cost | $1,152.28 | $632.29 | $398.97 |
After simulated children are created they enter a cycle of four steps (Figure 2):
- Comorbidities are randomly assigned to the population using prevalence calculated from the ENSANUT 20063 database shown in Table 2. Because no prevalence or incidence data for these comorbidities was readily available for Mexican children we used adult prevalence and smooth it with an exponential curve from 5 to 30 years old: factor = 0.02*e (0.1304*Age)
- Chance of increasing or descreasing weight level is evaluated by the model according to obesity prevalence reported in the ENSANUT 20063 for ages 5 to 20 and for 30, 40, 50, 60, 70 and 80 years old
- Each year chances of dying for each person are evaluated using CONAPO’s life table for all population with double chances of dying for overweight group and three times chances for obese children
- Population that still alive increases age by one year, also in this step a 3% discount rate is applied to comorbidities costs
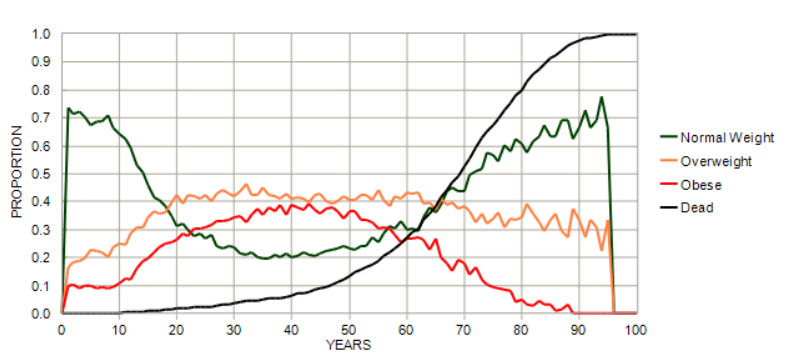
Prevalence for each obesity level and proportion of dead population during each simulated year is shown in Figure 2.
The Results
Next, we present results obtained after making 10 replications of the model described above. In Table 3 we can observe that females with normal weight obtained the highest life expectancy; on the contrary, obese male population had the shortest lifespan with a difference between both groups of 14.38 years.
Average man costs due to obesity were more than double the normal weight man; obese woman average cost almost doubled the average normal weight woman cost. It can also be observed that a higher proportion of male population died with overweight while most women died being obese. Average total cost are shown in Table 4.
Table 3: Proportion of deaths, life expectancy and average cost by weight
| Gender | Weight Level | Death Proportion | Life Expectancy (95% IC ) | Average Cost (95% IC ) | Incremental % Cost |
|---|---|---|---|---|---|
| Males | Normal Weight | 36.10% | 76.56 (75.75-77.36) | $1,988 (1,961-2,015) | 0% |
| Overweight | 63.90% | 72.67 (71.84-73.51) | $3,155 (3,137-3,173) | 59% | |
| Obesity | 45.30% | 64.38 (63.55-65.21) | $4,681 (4,653-4,709) | 135% | |
| Females | Normal Weight | 21.80% | 83.30 (81.65-84.95) | $2,303 (2,268-2,337) | 0% |
| Overweight | 46.20% | 77.36 (75.76-78.95) | $2,741 (2,716-2,766) | 19% | |
| Obesity | 53.80% | 69.12 (67.29-70.95) | $4,358 (4,338-4,378) | 89% |
Table 4: Total comorbidities costs for 5 to 11 years old Mexican population
| Total Costs (95%IC) (1*1,000,000) | Incremental % Cost | |
|---|---|---|
| Normal Weight | $10,315 (9941 - 10689) | 0% |
| Overweight | $21,049 (20584 - 21514) | 84% |
| Obesity | $22,606 (22339 - 22873) | 108% |
The Conclusion
It is a well-known fact that overweight and obesity have become an economic burden to most health systems across the world. This model presentation is an alternative tool to project costs resulting from the three most common metabolic disorders associated to obesity in adulthood: diabetes, hypertension and hypercholesterolemia
Results are disaggregated by gender and by weight level of a children population during its lifespan. Results yielded by the model for the Mexican population, using drugs and doctor’s visit costs only, showed an 84% incremental cost for the overweight population compared with the normal weight and the obese had an 108% extra costs compared to the normal weight population.
Achievements with Simul8
FUNSALUD now understand the financial impact of childhood obesity and have highlighted where investment is required in services to cope with future demand. The study showed:
- Overweight population is likely to incur an additional healthcare cost of 84%
- The costs to treat obesity are projected to rise by 108%
- The obese male population had the shortest life expectancy which was 14 years less than a normal weight female
It is a well-known fact that overweight and obesity have become an economic burden to most health systems across the world. The ability to project how this increase in demand will affect front line services will be key to helping health organisations plan for the future.
FUNSALUD will develop the simulation further to include disease complications to project service requirements to a lower level of detail.
Learn more about Simul8 for healthcare process improvement
Find out more about how simulation is used by healthcare organizations, read more case studies and access a range of learning resources.
Learn more