Simulation software built for faster, more confident decisions
Build, test, and refine simulation models quickly using intuitive tools, powerful features, and a fast results engine. Simul8 lets you test decisions in a risk-free environment so your team can move faster and act with confidence before making real-world changes.
Build simulations faster every day
Make decisions in minutes, not months, with an intuitive interface and powerful features designed to help you build simulations at blisteringly fast speed.
Drag and drop simulations
Model any business process using a drag-and-drop interface that’s completely focused around speed to build and run simulations.
Intelligent building blocks
Use powerful building blocks to simulate and experiment with any element of your business, no coding needed.
Reusable components
Empower faster, routine decisions by saving and adding your most frequently used workflows, equipment and resources into any simulation.
One-click simulations
Create instant simulations with Process Mining, BPMN, Microsoft Visio and many other import features.
Build, run and share simulations anywhere
Give your team flexible access to the tools they need to build models, test scenarios, and share insights across desktop and browser-based environments.
-

Simul8 on desktop or in a browser
The only platform to offer the ability to build, run and share simulations using the same interface, extensive feature set and fast results on both web and desktop.
-

Share and collaborate
Securely share and drive collaboration by letting stakeholders get involved in experimenting with simulations. Shared simulations can be opened in a browser, allowing anyone to easily run and experiment - no downloads or installation needed! And if you prefer, your stakeholders can access a downloadable viewer mode too.
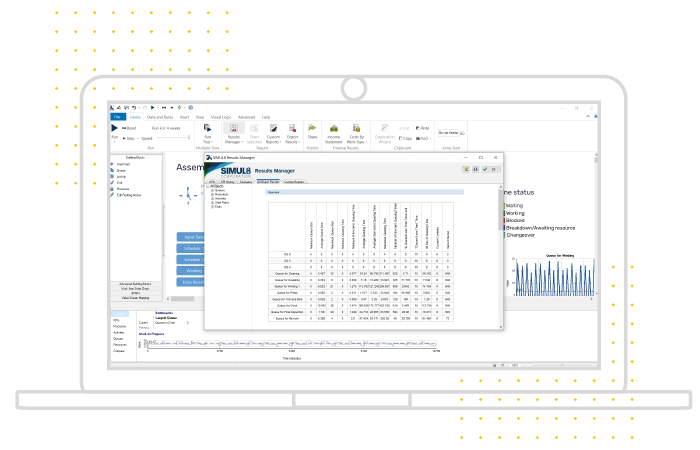
Make decisions faster with focused results
Use a fast results engine to uncover tradeoffs, evaluate scenarios, and focus on the outcomes that matter most to your team.
-

Extensive, actionable results
Every simulation object generates results, but you won’t be swamped by data. Simul8 helps you to focus on the KPIs that will inform your decisions.
-

Export to other tools
Every result can be exported to analyze or share using your tools of choice, including Excel, Google Sheets, R and more.
-

Plan for every scenario
With a powerful scenario manager, test multiple ideas or configurations in seconds, and uncover the most cost-effective and efficient way forward.
-
Find out more about OptQuest

Optimization
Pinpoint the right combination of variables to achieve your specific goals using OptQuest for Simul8.
Make decisions with connected, trusted data
Connect Simul8 to the data you trust so your models stay aligned with real conditions and your decisions are grounded in reality.
Rapid data connections
Link simulations to everyday productivity tools like Excel, Google Sheets, text and CSV files, or dynamic database connections via SQL and ODBC.
Instant process mined models
Import transactional logs from ERP, workflow management and other information systems to build an instant simulation of any process.
Connect to live data sources
Sync simulations with live data to build digital twins of your process or system for day-to-day, operational decisions.
Experiment using distributions
Use Simul8’s pre-built distributions for quick experimentation or create your own to match your business’ arrivals or schedules.
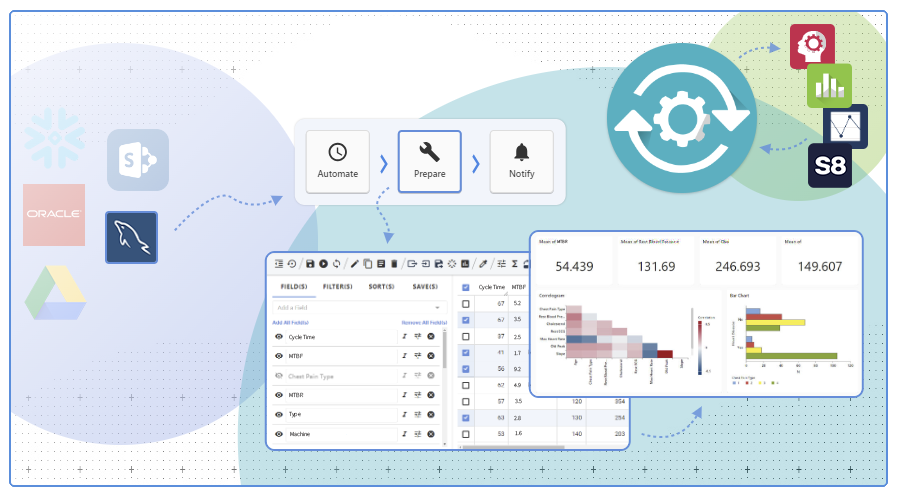
Simul8 + Minitab Connect
Sync simulations with real-world data
Simul8 integrates with Minitab Connect to remove one of the biggest barriers to repeatable simulation: data preparation.
Bring governed, prepared data directly into Simul8, refresh it when needed, and share outputs more easily. By keeping data preparation outside the model, teams can work faster and trust that every refresh follows the same rules.
-

Trusted data, by design
Use curated data from Minitab Connect, with consistent preparation, lineage, and governance built in.
-

Refresh with a click
Update your simulation with the latest data without rework or manual imports.
-

Close the loop
Send simulation outputs back to Connect for dashboards and shared decision-making.
Simul8 data connections
Simul8 integrates with a wide range of databases, cloud warehouses, spreadsheets and enterprise systems to ensure your models reflect what is happening across your operation.
For organizations managing complex data environments, Minitab Connect can centralize and automate those data flows, creating a reliable pipeline into your simulations. With continuously updated inputs, your models move beyond static analysis and support a scalable digital twin of your process.
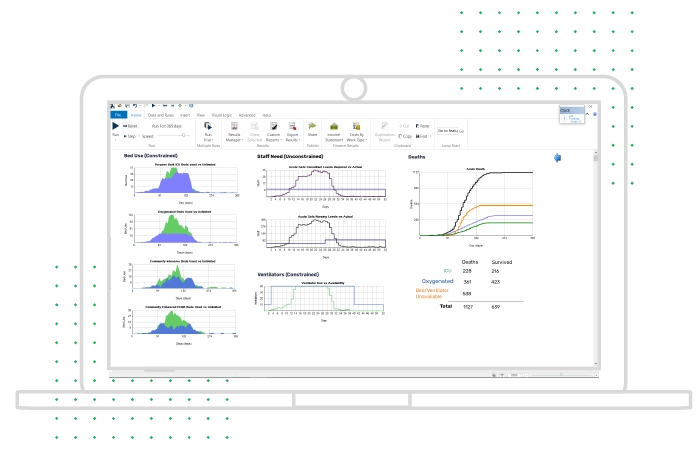
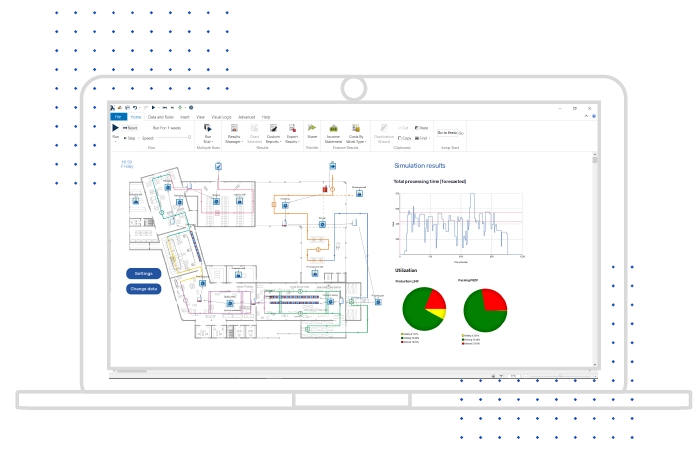
See decisions more clearly with visual simulation
Bring processes to life with animated models and interactive visuals that make it easier to understand impact, communicate change, and build stakeholder confidence.
-

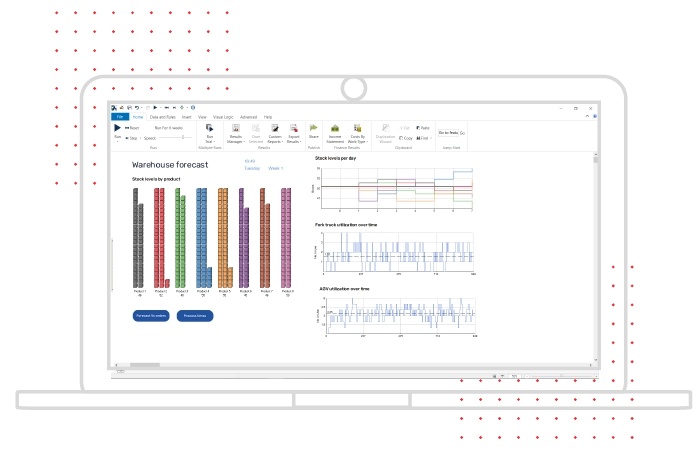
Fast, fluid 2D visualization
See the impact of decisions on your process at a glance with animated workflows and dynamic on-screen charts that show how KPIs change over time.
-

Pinpoint opportunities
With Simul8, you can instantly pinpoint opportunities to improve performance, from queues building up to resources turning red when overutilized.
-

Create interactive simulations
Turn your simulation into a powerful engagement tool to sell your ideas with interactive buttons and dialogs that anyone can use to control and edit simulations.
Use the right simulation method for the decision
Model a wide range of systems using discrete event, agent-based, continuous, and hybrid simulation methods, all within one flexible platform.
Discrete Event
Model any existing or proposed business process as a sequence of steps, like drawing a flow chart.
Agent-based
Model the behavior of individual people or machines to understand their impact on a process.
Continuous
Model objects that have a continuous motion, like the flow of water or gas in tanks and pipes.
Hybrid
Combine different techniques in one simulation to model a limitless range of processes.
Customize models your way
Simul8’s APIs and powerful scripting tool, Visual Logic, allow you to tailor simulations to your workflows, data sources, and technical environment.
-

Visual Logic
Our Visual Logic scripting tool lets you control any aspect of your simulation. Designed specifically for simulation it is part of what makes Simul8 the fastest simulation tool on the market.
Designed for simulation, Visual Logic provides you with the most intuitive scripting environment. With three modes it grows with you as you learn, and lets you control which environment works for you. From a simple wizard-driven UI to a fully fledged coding environment, anyone can code in Simul8!
-

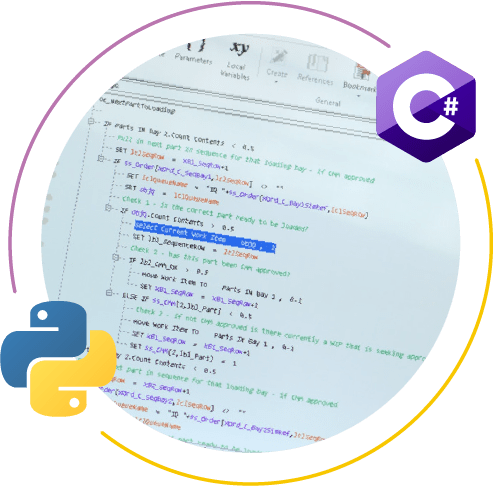
APIs
Control Simul8 from anywhere with our API. Use Python, C#, whatever your preferred language is to integrate simulation directly into your technology stack.
A simulation engine built for speed and scale
Built on decades of simulation expertise, Simul8 helps teams move faster with modern capabilities that support adaptive models, live data, and broader operational use.
APIs and data hooks
Use our APIs and live data hooks to link us into your technology stack and systems.
Process mining
Build the entire structure of your simulation from your data log in a single click.
Machine learning
Build the rules and timing of your simulation from your data log. Your simulation is always up to date with no lengthy validation periods.
Share
Give anyone in your organization the power of simulation without needing to know how to build. They can run Simul8 for daily decision-making.
Boost your simulation capabilities
Add optimization and version control to test more options, manage change more easily, and move from ideas to better decisions with less effort.
Version Control
Stay on top of every change with Simul8's fully integrated Version Control. See what changed, who changed it, and when, with the ability to review, compare, or roll back at any time. Multiple people can work on the same simulation simultaneously - no risk of overwriting and no external tools required.
OptQuest
OptQuest seamlessly integrates with Simul8, transforming your simulations from “what if” to what's best. With intelligent optimization, you can test thousands of parameter combinations in minutes—uncovering the most efficient, cost-effective, and impactful solutions with confidence.
Scale your Continuous Improvement with structure and speed
When simulation shapes your decisions, it helps to have a clear path from insight to action. With Simul8 connected to Minitab’s improvement tools, teams can stay aligned, work more consistently, and turn simulated improvements into real-world results.
Minitab Workspace
Take your process improvement projects further by combining Simul8 with Minitab Workspace. Build out the structure of DMAIC or other continuous improvement methodologies around your simulation work to bring clarity and direction - taking you from experimentation to confident action.
Minitab Engage
Minitab Engage helps organizations run continuous improvement projects in a repeatable, scalable way. When Simul8 connects into Engage, simulation becomes a core tool in the wider improvement ecosystem. Results flow directly into templates, reviews, and dashboards, creating a clearer path from individual simulations to organization-wide improvement.
More than software, support that helps you move faster
Simul8 is easy to use, and when you need help, our team is ready to support you.
From onboarding to advanced modeling questions, we help teams get more value from simulation faster. But don’t just take our word for it. See what customers say about working with us.

"Simul8 customer support and training staff are outstanding! This support is what sets Simul8 apart and allows basic users to create models to support business decisions."
Isaac M., Director of Operations
Hospital & Healthcare
Simul8 user review from
"Product is easy to use but the absolute BEST feature is the support. I can shoot an email with a question and get a very helpful response in under a day or, even better, I have emailed them my file and had support respond with where my error was. I wish I could give them 6/5 stars in this category"
Kristina N., Industrial Engineer
Mechanical Engineering
Simul8 user review from
"The software is intuitive and easy to use… But the BEST thing about this software is their technical and customer support. It is best to none. Simul8 is a company that makes each user valued and for this reason is always ready to help you with any questions you might have. If I could give it 10 marks, I would."
Alicia M., Course Leader
Education
Simul8 user review from
"When I can't find the solution to a problem the customer support team can. They're extremely helpful and will always provide you with an answer, but they'll also always provide additional information on the topic that’s troubling you and will help teach you how to find the solution, so this particular problem won't trouble you in the future. Great product and great support."
Callum E., Information Analyst
Hospital & Healthcare
Simul8 user review from
"The customer support and development team have been incredibly helpful, skilled and overly available to assist me during my initial learning phase."
Chris B., Developer/Administrator
Medical Devices
Simul8 user review from