Simulation Solves, Technical Corner
#SimulationSolves – no more summer queues!
 Brian Harrington / Jul 13, 2015
Do you want a summer where you don’t have to queue for attractions? Simulation can help make that happen!
Ski resorts are not just for winter anymore! Most of today’s ski resorts are open during the summer months for outdoor activities such as: hiking, mountain biking, zip-lining, and alpine sledding. One of the fastest growing outdoor activities on the mountain slopes is the zip line. A typical zip line course consists of several zip lines; starting with a learning line and advancing to longer, higher, and faster lines.
As the popularity of zip-lining gains momentum, so does the expansion of activities, including additional zip lines. This is where simulation can aid within the layout and operational aspects of maximizing your summer fun, along with protecting the resort’s costs and revenues.
Zip line layout & operational procedures
A typical group consists of 12 “flyers” or “zippers”. Each group will have 2 dedicated guides, assuring zippers’ safety and zip line protocol. The group starts off with signing waivers and weighing in. Once zippers have been properly fitted with harnesses and trolleys, they are then instructed to watch a 15 minute instructional video.
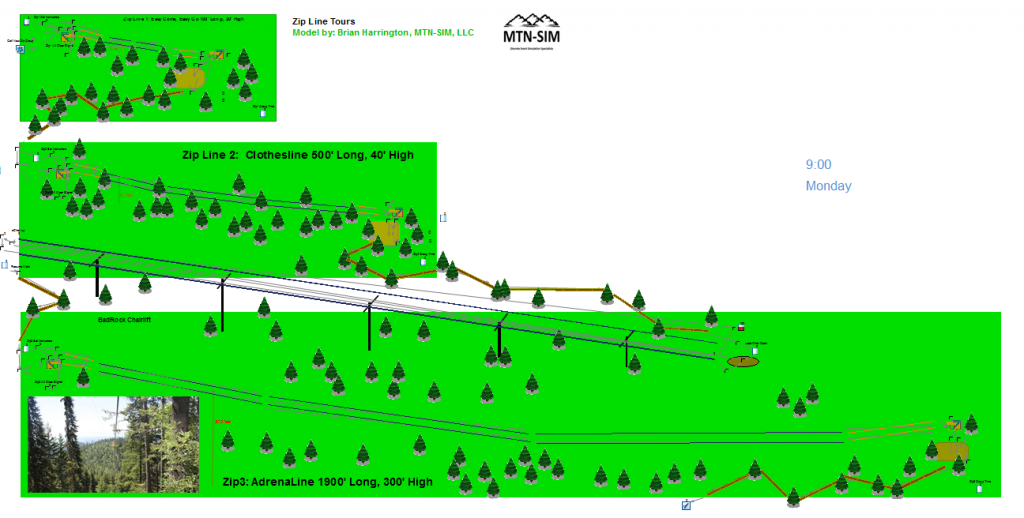
Maximizing zip line experience and assuring a safe and fun outing does not happen by chance. Setting up a course that spans over 100 plus mountainous acres and contains over one mile of zip lines requires a lot of upfront planning. Our example zip line course consists of 7 unique runs that range from the 100 foot training run to the 1900 foot Adrenaline line. The seven line zip course will include some hiking including a chair lift ride as well, therefore, the course needs to be laid out with a logical hiking trial with timing in mind.
It is important assure that all the operational procedures are in place to maintain flyer satisfaction for 2.5 hours to conquer all 7 zip lines. There are several questions to determine the best way to deliver and maintain flyer satisfaction.
Simulating zip lines
The simulation model contains all of the pertinent data to predict realistic results. The input data sets include user profiles for a typical group of 12 flyers. Random groups are automatically generated, each flyer will have a unique attribute profile including their weight. The weight is a significant factor effecting the maximum speed on each respective zip line. The lighter flyers may have trouble making it to the landing platform. For example the 500 feet long line and has a slight upward approach. Here lighter flyers will be instructed to stay in the pencil position to maintain their speed for the landing entry. If they fall short of making it to the platform, the bottom zip guide will throw them a rope and pull them on to the landing platform. This detail has been included within the simulation. That is why we will see a larger range for the time it takes an average group to complete the 2nd zip line. The model contains user defined algorithms to dynamically adjust the flyer’s speed according to their body weight and flying position. There are three main sectors of a lines speed logic: Take Off, Middle Speed, and Landing.
The results
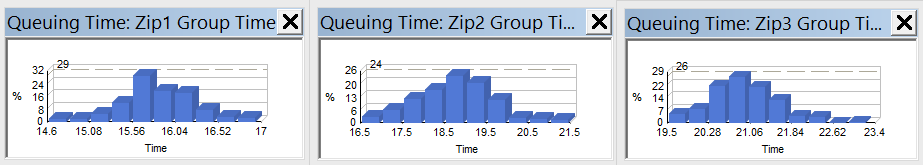
We can look at all of the individual flyers’ statics per flight, however, it is more useful to see the group’s overall figures. The below graphs represent the total time for a group to complete a specific zip line in minutes. It shows an average time of 15.9 minutes for the training zip line, 18.7 minutes for the 2nd, and 21.0 minutes on the 3rd zip line. The model was run for a 2 week period, Monday – Sunday, with operating hours from 8:30am to 4:30pm. Therefore, there were 156 groups that headed out to the lines – an average of 11 groups per day.
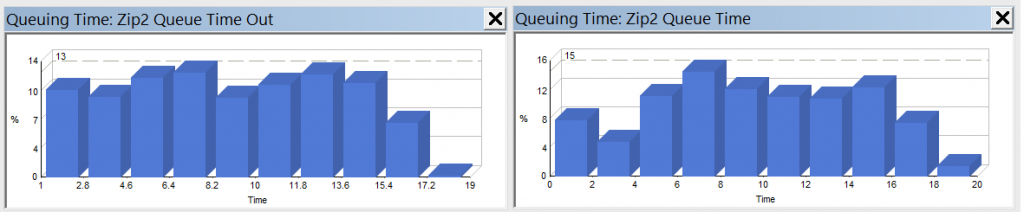
The next important topic was addressing the average time a flyer waits before their turn. The queue time typically has a direct correlation to customer satisfaction in most business situations. People do not like waiting in lines, so consideration was engineered into assuring acceptable waiting times. The below graph shows the wait times for the 2nd zip line with an average of 9.4 minutes to fly, and 8.9 minutes to wait for the remaining group.
The next related consideration was ensuring that another group will not catch up with the group that is ahead of them. This situation would cause unacceptable delays, waiting for the group ahead to finish and vacate the platform. This is where the simulation can address the scheduling of groups, and setting up an optimal schedule for the day. Within the simulation we can set up broadcast points at various locations to signal when to send out the next group. Then we can examine how much time has elapsed between the “next group” signal. In this particular scenario of 3 zip lines and a chairlift ride; the optimal signal was after completing the 2nd zip line. Therefore, the next group to hit the training line will be after the group ahead has completed their 2nd zip line. This schedule allows for up to 11 groups per day, with minimal chances of interfering with one another. It was also determined that a group can complete the 3 zip line course within 90 minutes. Therefore, in theory, the resort’s paired zip guides could handle 5 groups within a shift. Although, they feel it’s best to allow for additional fresh zip guides, thereby sharing other duties such as organizing and maintaining the equipment. This also spreads the fun factor for the zip crew staff, ensuring that each zip crew member can also enjoy the outdoors.
Lastly, the simulation included the “Bad Rock” chairlift. All of the chairlifts were existing lifts that are used during the winter ski season. The Bad Rock Chairlift takes people 1,627 feet from the Base Lodge and climbs up 461 vertical feet. The location and elevation gain of the Bad Rock chairlift was ideal for setting up additional zip lines with spectacular views, speed, and range. This is where the 1900 ft, 300 ft high Adrenaline Line is located! The chair lift carries 2 flyers per chair, and takes around 5 minutes to reach the top. Usually, flyers are talking and having fun, so you will often see empty chairs between pairs. This is not a problem, and has been accounted for within the simulation. The chairlift requires staff chair operators at the load and unload points during operation. Therefore, the question was “How often will the lift be running”? The simulation results show that the chair lift will be moving 15% of the time. The remaining time it can stop and wait for the next group to arrive, which will be within 40 minutes.
As we can see simulation studies are not just useful in manufacturing applications. This is a great case study that uses most of the sophisticated tools at hand to assure a safe and fun experience for the 1000’s of flyers that will hit the slope for some summer fun! The resort was able to conduct “What If” analysis as they expanded their operations to include future zip lines. They were also able to examine future demand increases and scheduling of their internal zip line crew. It goes to show that simulation can take you to the peaks!
Please note the above case study only is depicting 3 Zip Lines. The actual study included all 7 Zip Lines.
About the author
Brian Harrington
Brian Harrington is a Six Sigma Black Belt with 20 years operations research and simulation experience at Ford Motor Company. He designs and implements manufacturing process improvements which incorporate many conflicting objectives such as robust, flexible, and lean systems. As part of FMC’s “Advanced Manufacturing Team” he has expertise in several simulation packages, including over 20 years with SIMUL8.