This SIMUL8 Tip looks at using Path Densities in SIMUL8 to identify and analyze commonly used routes. Path Densities in SIMUL8 Professional allow the routing arrows of a simulation to change based upon the number of Work Items that travel along each route.
Path Densities can be turned on in the from the ‘View’ tab.
There are three options available to the user (see screen shot below)
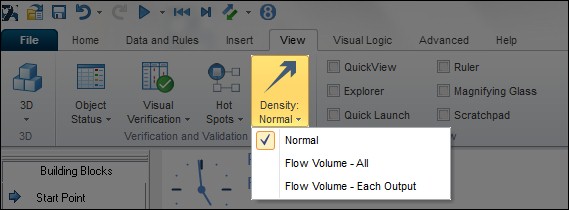
1. Normal
This will display the routing arrows as you would normally expect and they will remain unchanged during the simulation run.
2. Flow Volume – All
The thickness of the routing arrows will change to indicate the routes that have the greatest amount of Work Items flowing through them. As Work Items flow from a Start Point to a End Point the thickness of the arrows will decrease.
3. Flow Volume – Each Output
The thickness of the arrows will vary at each simulation object based upon the number of items flowing in and the number flowing out. If, for example, an Activity has two routes out with 66% and 33% then the 66% route will have a larger thickness of routing arrow.
After selecting option 2 or 3 above, the routing arrows will change to dashed lines to indicate that Path Densities are being used.
Once the Path Density option has been selected, the thickness of the routing arrows will update at the end of the simulation run.
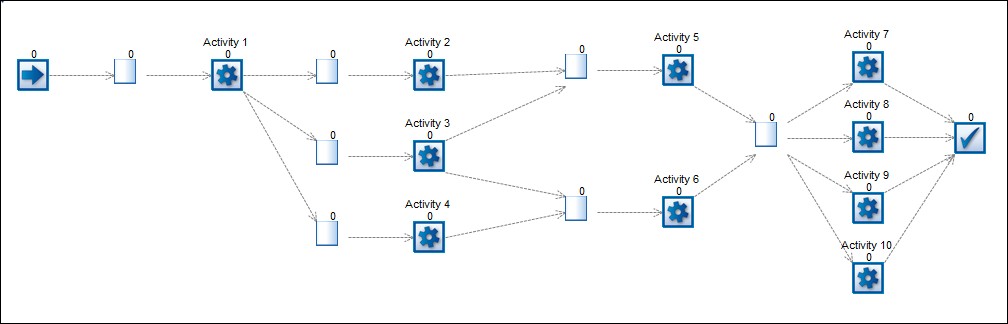
Example
To illustrate these options the small model below has been used. This is how the simulation looks before using the path densities feature.
Flow volume – All
The illustration below shows the model above at the end of the simulation run with the ‘Flow Volume – All’ feature selected.
With this feature you can set the width of the link arrows between the objects to convey the volume of product that has traveled between each object during the course of the simulation run.
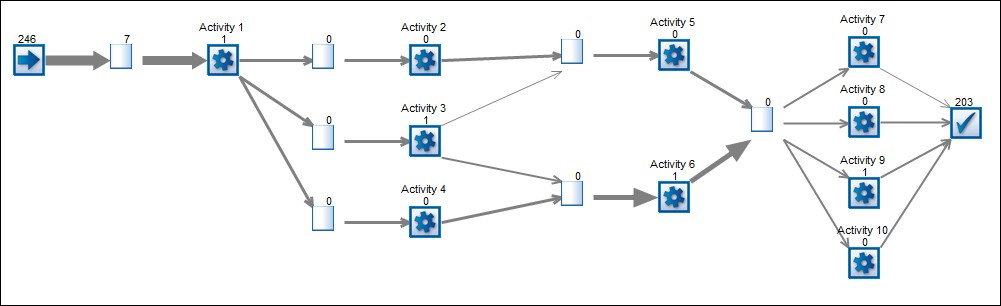
The width of the link arrow is set as a proportion of the volume of product between two objects. The proportions is calculated by comparing the volume passing between two objects with the largest volume between any two objects with the model. The width of the link arrow between all objects is comparable with this setting.
This feature allows users to instantly identify the most frequent path being taken by work items in the model. This type of analysis can not only be used to verify the model routing logic but also to help with critical path and de-bottlenecking analysis.
Flow volume – Each output
With this feature setting the width of the link arrows are not comparable across objects.This is because the link arrow width is calculated for each object individually. The width for each output is set to that outputs volume as a proportion of total volume leaving the object.