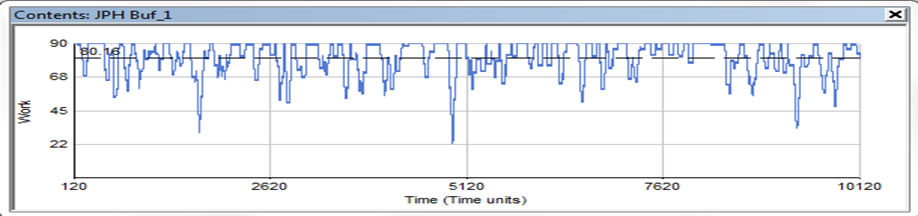
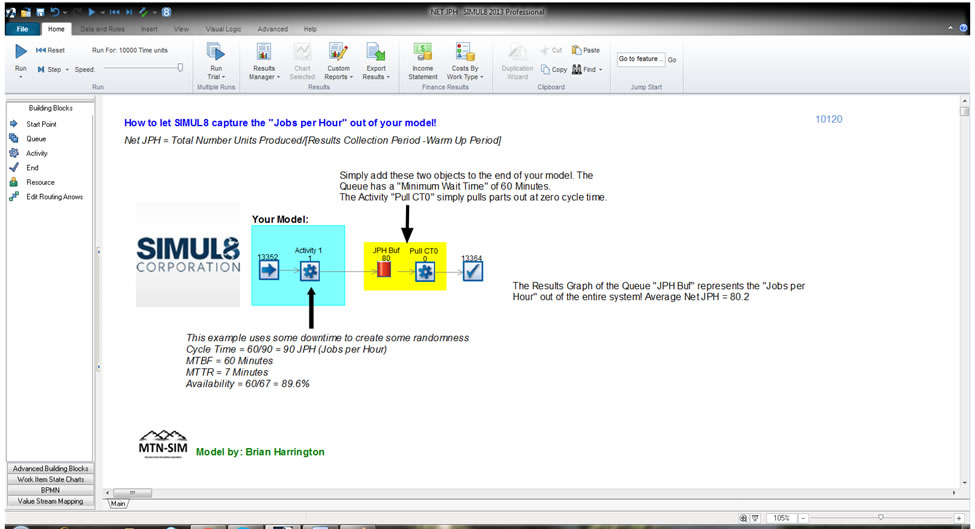
An easy way to get a descriptive representation of the throughput of your simulation is to use a “dwell buffer” of 60 minutes. This will create a graph that represents the “Jobs per Hour”, “Units Produced per Hour”, or “Customers per Hour”, etc, out of your entire simulation. The best part is that this can be done in just 3 easy steps!
Read on to find out how.
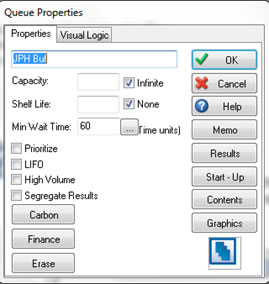
- Just add a Queue with “Minimum Wait Time” set to 60 minutes.
- Then you will need an Activity with its Cycle Time set to Zero, to pull the units out of the buffer.
- Then examine the Results > Graph of your Queue!
You can validate your findings against the equation: Net JPH = Number of Units Produced/[Results Collection Period-Warm Up Period]
To download an example simulation, simply click on the screenshot below!
About the author

Simul8
For over 20 years we've been working with organizations around the world to transform processes. Our intuitive software is relied on to help make million dollar decisions. From Ford to NASA, Geisinger to Boston Scientific, SIMUL8 Corporation's powerful software is being used to increase efficiency, reduce costs and improve processes.