This SIMUL8 Tip takes a look at another new feature to SIMUL8 2014, Queue Visualization. This feature is great for providing you with instant results as you can see the content of your Queues by Label whilst your simulation runs.
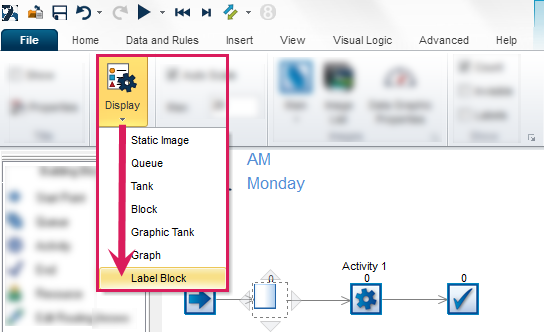
To access this feature select a queue on screen, navigate to the Graphics Tab and choose “Label Block” from the display drop-down.
In the Label Block options, you must choose the label that you want to see the visualization for. Enter the high and low values, and choose colors to represent these values. Any values in between will represent a gradient.
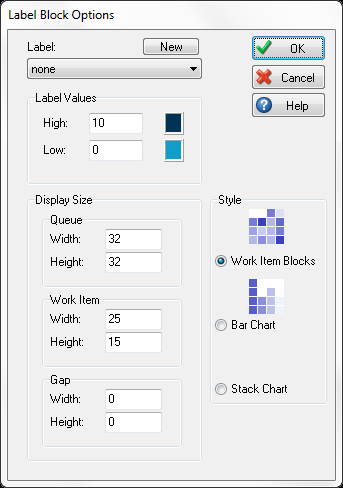
Below are all the options that you have access to, each of these gives you control over how you view your queue on screen including the size, style and gap you’d like to have.
Label: Choose the label for which you want to use for your queue.
Label Values: Choose the high and low values which you want to represent for the label value chosen. Any colors in between these values will appear as a gradient between the high and low value’s color.
Display Size: Choose the width and height of the queue on the simulation window.
Work Item: Choose the width and height of each individual work item displayed in the queue.
Gap: Choose the width and height of the gap between the work items in the queue.
Style: This allows you to choose how to represent your work items.
Work Item Blocks: Displays work items as they arrive into the queue. There is no organization of work items using this style.
Bar Chart: Displays the work items as a bar chart. This will segregate the work items by color (value) and display the amount of each value.
Stack Chart: Displays a horizontal chart to gauge the percentage of each value in the queue.
Once you have chosen all your options, simply run the simulation and you will begin to see results on screen!